The stock market is a vast ocean of data, with thousands of companies vying for attention. For a newcomer, especially one from the fast-paced crypto world, it can be overwhelming. Where do you even begin? The answer lies in focusing on the action. This is where Stock Analysis Market Movers become the most critical tool in your arsenal. These are the stocks making significant moves—up or down—and they tell a story about market sentiment, industry trends, and potential opportunities.
Unlike the 24/7 crypto market, the stock market has defined hours, but the action is just as intense. Understanding what moves a stock and how to analyze that movement is the first step toward building a robust investment strategy. This guide will provide an in-depth analysis of market movers, breaking down how to find them, what they mean, and how you can use that information to make smarter decisions. Welcome to your foundational guide from Stock Analysis.
What Are Market Movers in Stock Analysis?
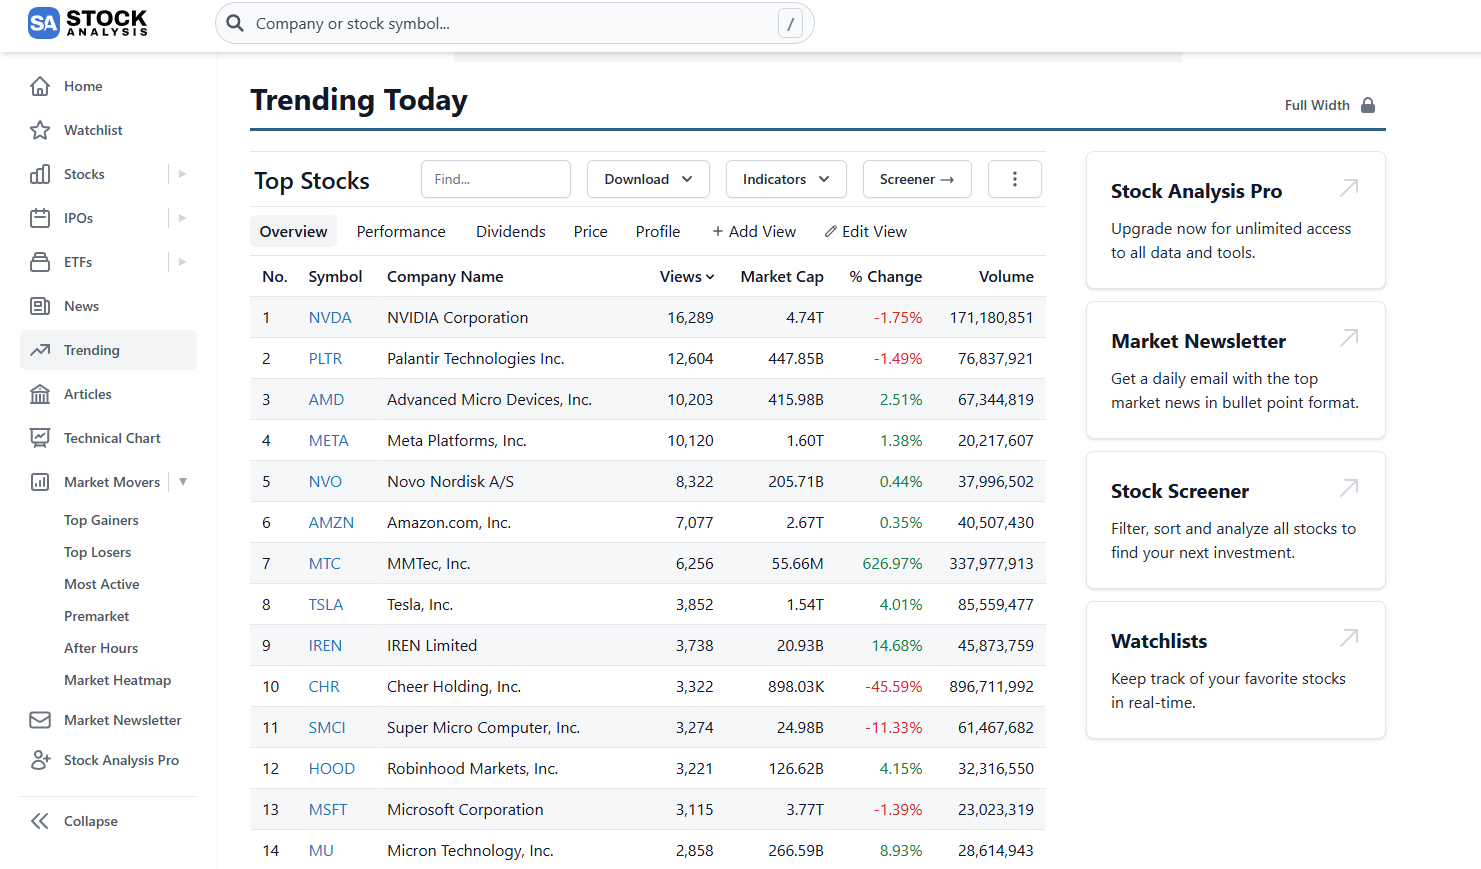
At its core, “market movers” is a term used in stock analysis to identify the stocks that are experiencing the most significant changes during a trading day. These changes can be measured in several ways, and each provides a different piece of the puzzle.
For a beginner, it’s best to think of them as the “trending topics” of the stock market. They are the companies everyone is suddenly talking about, trading, and watching. These are typically categorized into three main groups:
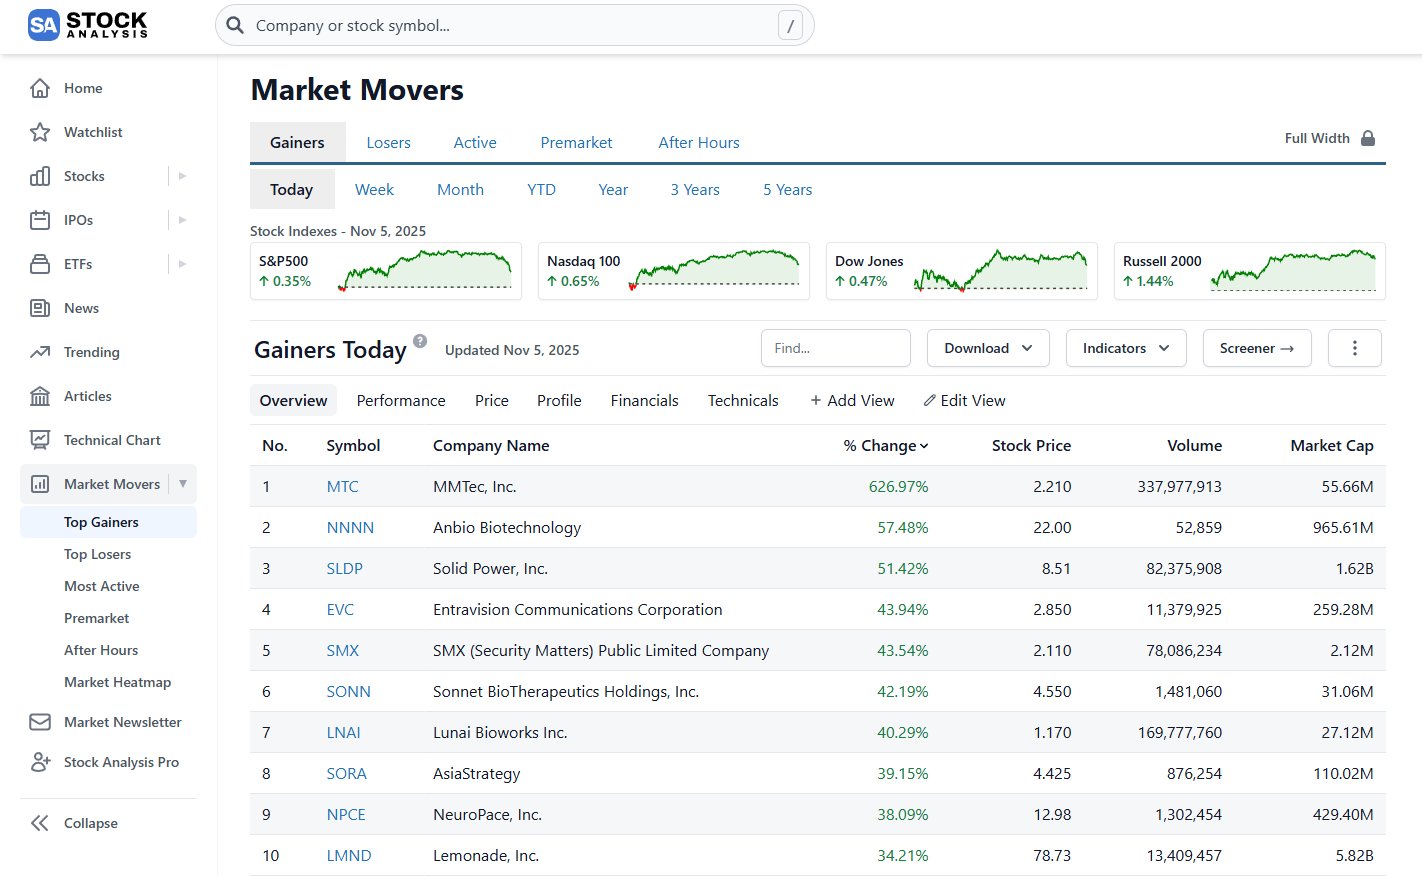
Top Stock Gainers Today
These are the stocks that have experienced the highest percentage increase in price since the previous trading day’s close. It’s not uncommon to see stocks on this list that are up 20%, 50%, or even 100%+ in a single day.
- What it means: A major positive event has likely occurred. This could be a stellar earnings report, a new product announcement, a successful clinical trial, or a buyout offer.
The Newbie’s Pitfall
Seeing a stock up 100% and jumping in (FOMO). Often, by the time it’s on this list, the initial move has already happened. The key is understanding why it moved.
Top Stock Losers Today
Conversely, these are the stocks that have seen the largest percentage decrease in price. These are the “rockets” falling back to Earth, often just as quickly as they rose.
- What it means: This almost always signals bad news. Examples include a missed earnings target, a product failure, a regulatory crackdown, or negative analyst ratings.
The Newbie’s Pitfall
Trying to “catch a falling knife” by buying a stock that’s crashing, assuming it must bounce back. Without understanding the reason for the drop, this is pure speculation.
Most Active Stocks Today (By Volume)
This list shows the biggest stock movers by volume. These are the stocks with the highest number of shares changing hands, regardless of their price change. A stock could be on this list and only be up or down 1%.
- What it means: This signifies immense interest. A high-volume move (either up or down) lends validity to the price change. It shows that large numbers of investors are participating.
The Newbie’s Pitfall
Ignoring volume. A 50% gain on 1,000 shares is a non-event. A 50% gain on 100 million shares is a major market signal.
Why Should a Crypto Trader Watch Stocks Moving Today?
If you’re coming from the crypto world, you might wonder, “Why bother with stocks?” The systems are different, the hours are limited, and the volatility (on most days) is lower. However, tracking daily market movers stocks provides invaluable skills and insights.
- Understanding Sentiment: Both crypto and stocks are driven by human emotion: fear and greed. By watching how the market reacts to news (e.g., an earnings report), you can see real-time sentiment in action.
- Recognizing Catalysts: The crypto market is often driven by hype, partnerships, or macro-events. The stock market is similar but more structured. Learning to identify fundamental catalysts (earnings, management changes, industry reports) is a skill that translates directly.
- Spotting Cross-Market Correlations: The lines are blurring. Companies like Coinbase (COIN), MicroStrategy (MSTR), and various crypto mining companies (RIOT, MARA) are “stock” market movers whose prices are directly tied to the crypto market. Watching these can give you a different perspective on crypto sentiment.
According to a 2024 NYSE report, over 80% of significant single-day moves are tied to specific news events like earnings or M&A.
A Beginner’s Guide to Analyzing Daily Market Movers Stocks
Seeing a list of stocks moving today is just the first step. The “in-depth analysis” comes from asking one simple question: “Why?”
Here is a simple framework for your analysis.
Step 1: Look Beyond the Percentage (Check Volume)
As mentioned, volume is your “conviction-meter.”
- High Gain on High Volume: This is a strong signal. It means a large number of investors believe in the new price and are actively buying.
- High Gain on Low Volume: This is a weak signal. It could be a small group of traders pushing the price up, and it could collapse just as quickly.
Pro Tip
Always compare the day’s volume to the stock’s 30-day or 90-day average volume. If today’s volume is 10x the average, something significant is happening.
Step 2: Find the News Catalyst
Stocks don’t move 30% in a day for no reason. You must become a detective. Look for:
- Earnings Reports: Did the company just announce its quarterly profits? Did they beat or miss expectations?
- Press Releases: Check the company’s “Investor Relations” website. Did they announce a new CEO, a new product, or a big partnership?
- SEC Filings: This is more advanced but where the real gold is. Did they file for a new offering? Did an insider buy or sell shares?
- Analyst Upgrades/Downgrades: Did a major bank (like Goldman Sachs or J.P. Morgan) change its rating on the stock?
A study by the Financial Analysts Journal found that high-volume breakouts (a key “market mover” event) have historically shown a stronger tendency to continue their trend in the short term compared to low-volume moves.
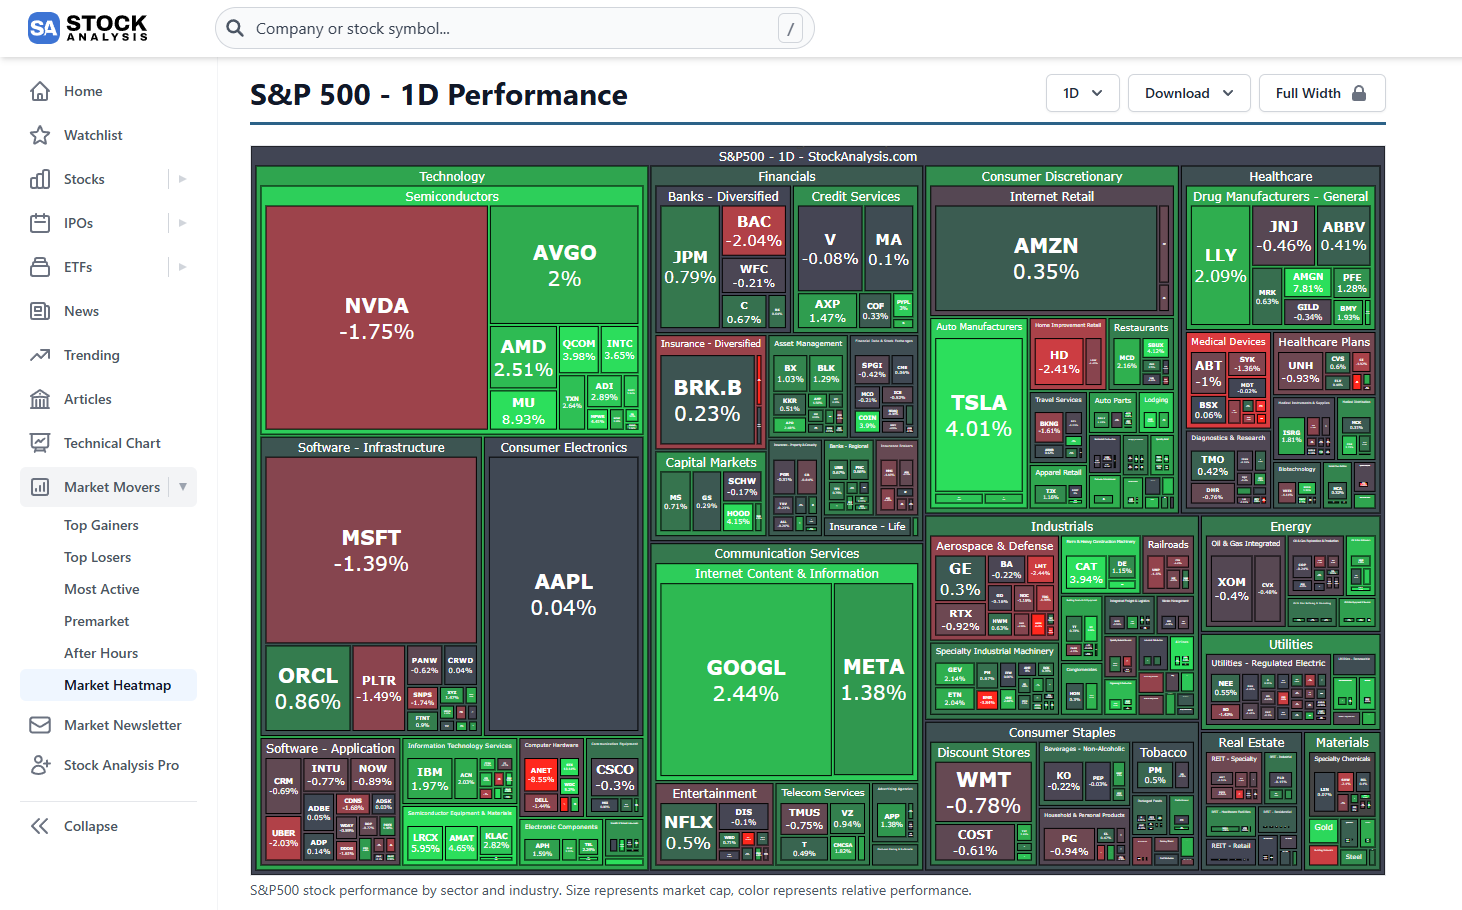
Step 3: Check the Sector and Industry
Is it just this one stock, or is the entire industry moving? If all solar stocks are up, it’s likely due to new government legislation or a breakthrough in the technology. If only one is up, the news is company-specific. This context is crucial.
For a deeper dive into these techniques, you can explore our in-depth stock analysis tools, which can help you screen for these criteria.
Understanding Pre-Market and After-Hours Stock Movers
For a crypto newbie, the 9:30 AM to 4:00 PM EST trading day feels incredibly restrictive. However, the action doesn’t just happen during those hours. This is where pre-market stock movers and after-hours stock movers come in.
What Are Pre-Market Stock Movers?
- Time: Typically 4:00 AM to 9:30 AM EST.
- What it is: This is when most companies release their major news, especially earnings reports. They do this before the main market opens to allow the information to be digested.
- Who trades: Primarily institutional investors and dedicated retail traders. Volume is much lower, which can lead to extreme price swings.
What Are After-Hours Stock Movers?
- Time: Typically 4:00 PM to 8:00 PM EST.
- What it is: Similar to pre-market, this is a time for news to drop after the market has closed.
The Risk
The “spread” (the difference between the buy and sell price) is often much wider in extended hours. It’s an advanced environment and generally not recommended for beginners.
However, watching the pre-market movers is an excellent way to prepare for the “opening bell” at 9:30 AM. It tells you what stocks will be in play for the day.
Common Pitfalls for Newbies Tracking Top Stock Gainers
Identifying market movers stocks is easy. Profitably trading them is hard. Here are the most common traps to avoid.
- Chasing “FOMO” (Fear of Missing Out): This is the #1 killer of new traders. You see a stock up 100% by 10:00 AM and buy it, afraid of missing more gains. Inevitably, the early buyers take profits, and the stock crashes, leaving you holding the bag. Rule: Never trade based on emotion.
- Misinterpreting “Most Active Stocks”: A “most active” stock isn’t necessarily a “good” stock. A failing “meme stock” or a company going bankrupt can be one of the biggest stock movers by volume as millions of shares are panic-sold. High activity can mean high fear.
- Ignoring the Broader Market: Is your stock dropping 5%, or is the entire S&P 500 dropping 5%? Context is everything. A stock holding its ground or even going up when the entire market is crashing is a sign of incredible strength. You can learn more about these patterns in our guide to [INTERNAL LINK: Stock Analysis Market Movers – Current Article Page URL].
Data from S&P Global indicates that retail investor participation, often focused on market movers, has increased by over 40% since 2020, highlighting their impact on daily volatility.
How to Start Your Stock Analysis Journey
The best way to learn is by doing (and observing). You don’t need to risk a single dollar to start.
- Find Reliable Data: You need a good scanner to find the top stock gainers today, losers, and volume leaders. This is the foundation of your entire process.
- Build a “Paper” Portfolio: Use a spreadsheet or a simulator. Every morning, pick 3-5 top movers. Write down why you think they are moving and predict where they will be by the end of the day.
- Review Your Results: This is the most important step. Were you right? Why or why not? Did you get faked out by a low-volume spike? Did you miss an important piece of news from the official SEC filings?
Key Takeaways
- Market Movers are stocks with significant price changes (Gainers/Losers) or high trading volume (Most Active).
- Volume is Key: A price move (up or down) on high volume has more “conviction” than a move on low volume.
- Find the “Why”: Always find the catalyst driving the move (e.g., earnings, news, analyst ratings) before acting.
- Avoid FOMO: Never chase a stock that has already made its big move. This is the most common trap for new traders.
- Use Extended Hours for Prep: Watch Pre-Market and After-Hours movers to see what news is driving the market and prepare for the next day.
Start Your In-Depth Analysis Today
Sign up for Stock Analysis to get access to real-time market data, advanced screeners, and the tools you need to find the next big market mover.
Start Your Free AnalysisConclusion: Making Market Movers Work for You
Stock Analysis Market Movers are not just a list of trending stocks; they are the heartbeat of the market. They are the nexus of news, money, and human emotion.
For a crypto investor, they offer a new and structured arena to apply your skills. You already understand volatility and the power of sentiment. By learning to analyze the catalysts behind stock movements—earnings, news, and volume—you add a powerful, time-tested methodology to your financial toolkit.
The journey from “Crypto Newbie” to “Informed Investor” starts with understanding stock analysis market movers. The key is to move from being a reactive chaser to a proactive analyst. Start observing, start learning, and build your framework for analysis.
Ready to find your first market mover?